How to Read a Bollinger Band Squeeze? First Distinguish Narrowing Volatility, Band Departure, and False Breakouts
From the band formula and bandwidth comparison to full candlestick confirmation, with an original illustrative diagram explaining the continuation and reversion that may occur after a Bollinger Band squeeze.
Author: Thomas | Technical Analysis Experience | October 19, 2026
A Bollinger Band squeeze is easily read as "an upward breakout is imminent." But the indicator itself only describes how dispersed prices have been around the moving average over a past period; a squeeze tells us volatility has narrowed, not the direction. Today, break the observation sequence into three steps: first confirm the squeeze, then wait to see how price leaves the range, and finally check whether it can hold after leaving.
What Each of the Three Lines Represents
Common Bollinger Band parameters are a 20-period simple moving average, with the upper and lower bands formed by adding and subtracting two times the price standard deviation over the same period. The middle band changes with sample prices, and the distance between the upper and lower bands changes with the standard deviation. If prices over the recent 20 periods are more concentrated, the bands tend to contract; if volatility expands, the bands tend to widen. 20 and 2 are only common settings; changing parameters will change the shape and the number of signals, so keep them consistent when comparing.
To observe a squeeze using bandwidth, calculate "upper band minus lower band, then divide by the middle band." Within the same instrument and same timeframe, a declining bandwidth indicates the bands are relatively narrowing. If the middle band is near zero or the calculation method changes, the ratio interpretation requires extra caution. Gold is usually not near zero, but different instruments cannot be applied without checking.
The Diagram Only Shows Structure, Not Real Gold Quotes
The illustrative diagram below shows narrowing bands on the left, with price staying within the bands in the middle; on the right, it places upward continuation alongside a spike and pullback side by side. The polyline is a teaching construct, with no price scale, time axis, or historical market data. The point is not to imitate this curve, but to see that the same "touching the upper band" can be followed by two different outcomes.
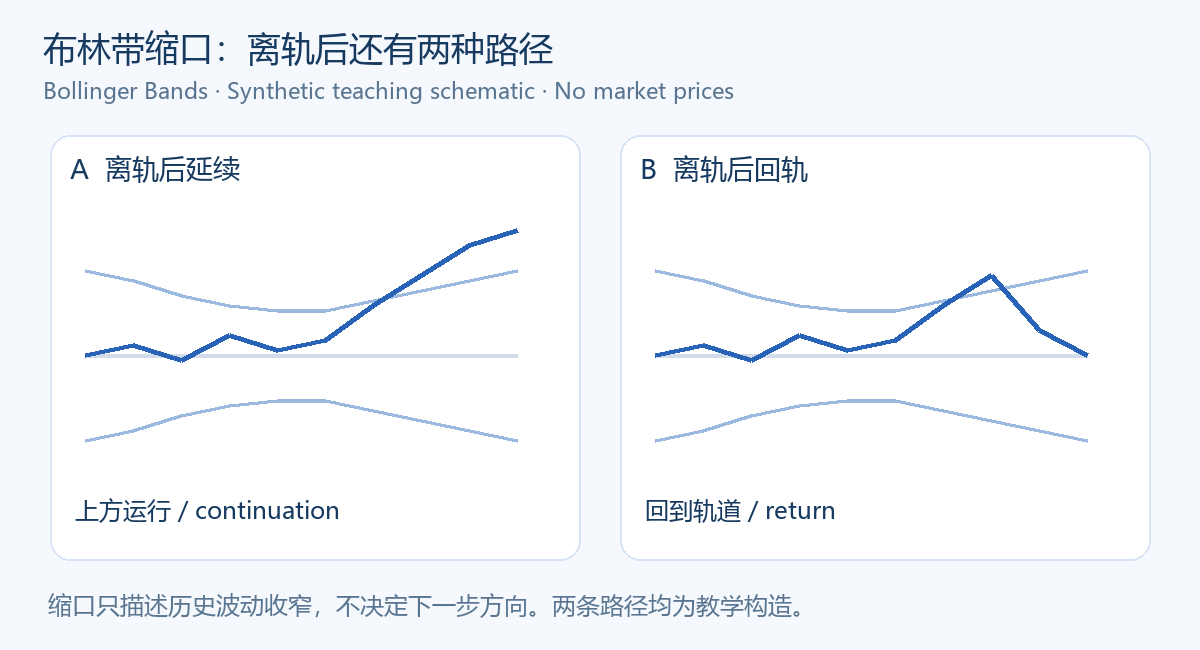
The diagram only explains the relationship between narrowing, departure, and return to the bands. Do not treat the height or path in the diagram as an XAUUSD target price.
Step 1: View the Squeeze Within Its Own History
Looking only at today's small distance between the upper and lower bands is not enough to identify an "extreme squeeze." A more reliable approach is to first fix the trading instrument, timeframe, and parameters, then compare the bandwidth's relative position across several comparable past observation windows. If it has merely gone from very wide to generally wide, or if there is a chart gap due to a temporary market closure, the conclusion is different.
Do not directly compare the bandwidth of a 15-minute chart with that of a daily chart, and do not carry over old thresholds after switching trading platforms. How long the squeeze lasts and whether the preceding trend already had a direction also affect interpretation. A squeeze is a preparatory condition, not an automatically generated entry condition.
Step 2: Touching the Band Is Not a Breakout, Let Alone a Confirmed Direction
Price touching the upper band may continue running along the upper band, or it may quickly return to the middle band; touching the lower band does not necessarily mean a rebound. Observers can predefine that only a full candlestick close confirms, rather than declaring a breakout upon seeing an instantaneous quote. It is also necessary to check whether the bands begin expanding at the same time, and whether this change persists over the following several candlesticks.
If the initial upward cross is immediately pulled back inside the bands, the earlier interpretation of upward continuation should be downgraded. Conversely, a brief return to the bands should not be mechanically understood as the end of a trend; it should be reviewed together with the originally set timeframe, structure, and risk conditions. Fidelity's educational materials likewise remind that false moves in the opposite direction may occur after a squeeze, and indicators should be used together with other tools.
Step 3: Write Handling Rules for Failure Scenarios
Suppose you have studied continuation outside the upper band in advance; then specify what change invalidates the judgment: for example, a close back inside the bands, with no subsequent reclamation of the prior structure. If studying continuation outside the lower band, write the conditions for returning to the bands in the opposite direction. The examples here are recording templates, not a universally applicable trading system; the timeframe and number of confirmation candles must be fixed before observation and cannot be changed afterward to preserve a view.
Also list widening spreads, data release times, and cross-platform quote differences as items to check. Gold prices may rapidly cross the bands back and forth at the moment of news, and the way the price used by the indicator is formed may differ from actual execution. If data quality is uncertain, you may choose not to draw a conclusion.
In Review, Count "Band Departure" and "Valid Continuation" Separately
Record the time the squeeze occurred, the bandwidth measure, the direction of the first departure, whether it was confirmed by a full close, whether it later returned to the bands, and the final result. Keep failed cases as well, so you can know whether "a squeeze must bring a big move" is merely cherry-picking successful patterns. Without real sample statistics, this article does not claim any win rate, nor does it force a certain segment of today's gold movement onto the teaching illustration. Technical indicators cannot eliminate the risk of loss in leveraged trading.

MT4 EA troubleshooting guides →